Complementary information
Some information about the performed classification can be retrieved.
Samples and confidence evolutions
You can run the confidence_map_exploitation.py easily with
python confidence_map_exploitation.py
It will generates two files in the Statistics directory.
The first one is the evolution of samples you manually placed at each iteration (example in
Figure 1). As you can see here, the evolution is almost linear, and it is a good practice
to follow to obtain quick results. Of course, in some difficult cases, the last iterations will
have less added points, to finely tune the classification.
The second one is the confidence evolution. The mean confidence of all the pixels should generally increase. The confidence of the samples you placed will probably slightly de- crease, as you will place more difficult points at each iteration.
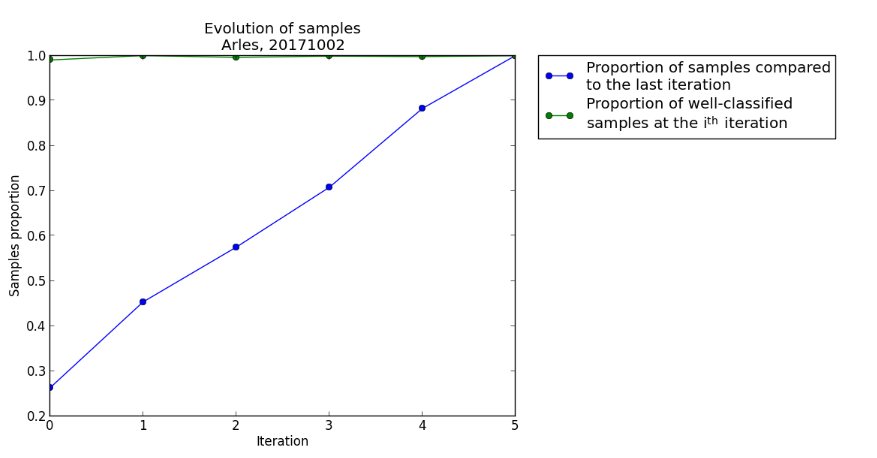
Figure 1: Evolution of samples. Arles, 20171002
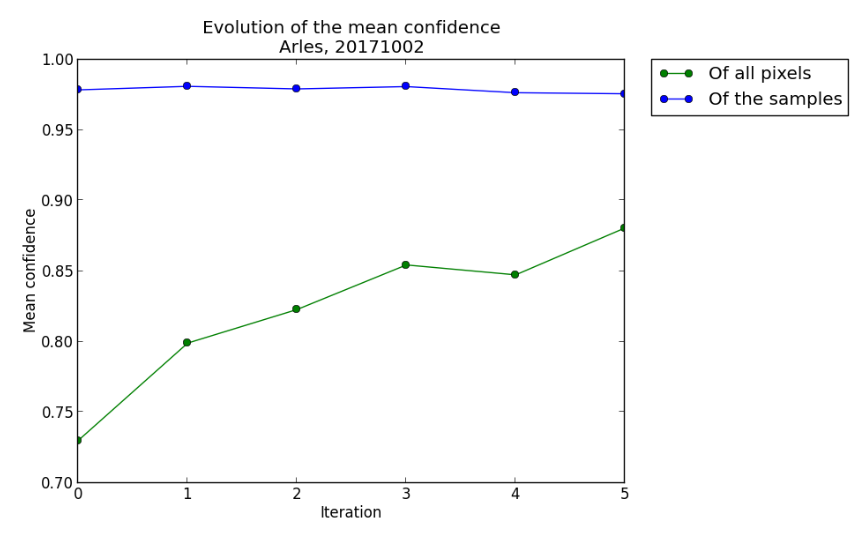
Figure 2: Evolution of the mean confidence. Arles, 20171002
K-fold cross-validation
At any point, you can perform a K-fold cross-validation with the samples you placed, by running
python all_run_alcd.py −f false −s 0 −kfold true
Go to the Statistics directory to see the result, notably the k_fold_summary.json file,
or the more eloquent kfold_metrics.png figure, an example of which is shown in Figure 3
To have a stable classification, the four scores should be as close to 1 as possible,
for each fold.
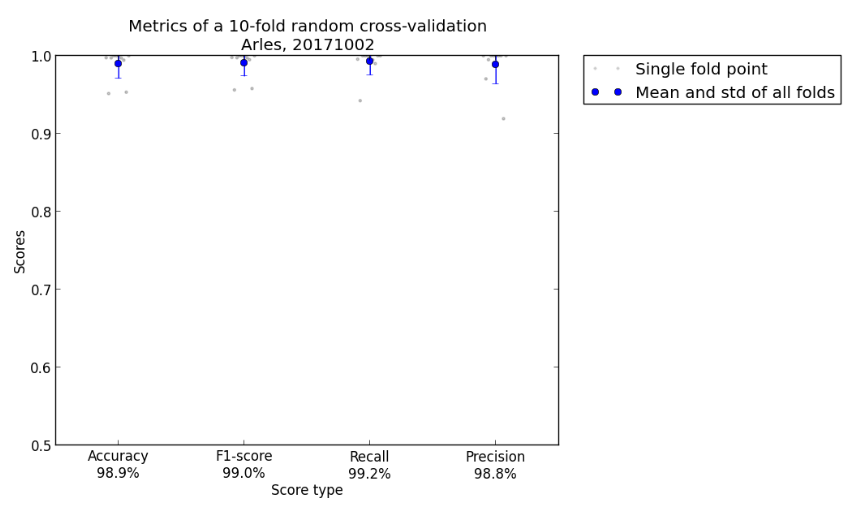
Figure 3: Metrics of a 10-fold random cross-validation. Arles, 20171002